Dashboard
SQL Account has a dashboard built-in to visualize:
- Cash Flow
- Ratio Analysis
- Outstanding Orders
- Top Product
- Profit & Lost (P&L)
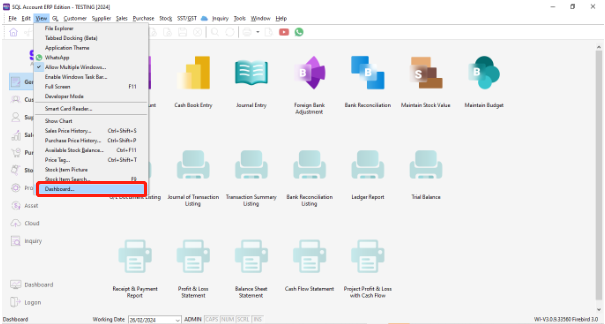
To access the dashboard, go to View | Dashboard
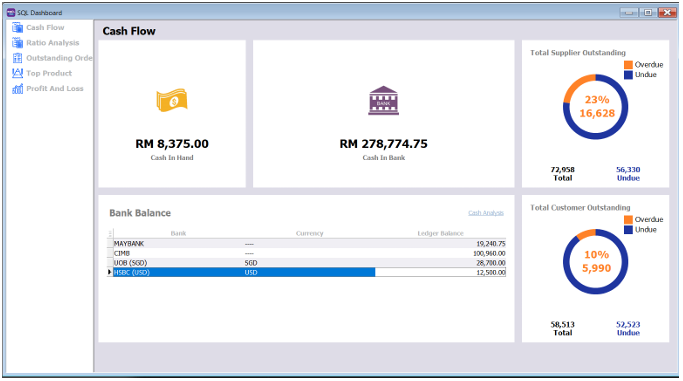
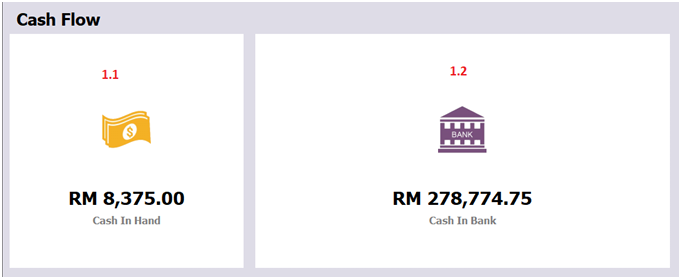
1. Cash Flow
-
You can see the latest balance for all Cash at hand and the Cash at Bank account balance.
-
The cash flow date is open dated.
-
The amounts are directly derived from the general ledger.
-
Cash In Hand

-
Cash in bank
The bank balance is obtained by calculating the bank balance of all banks. So for this example:
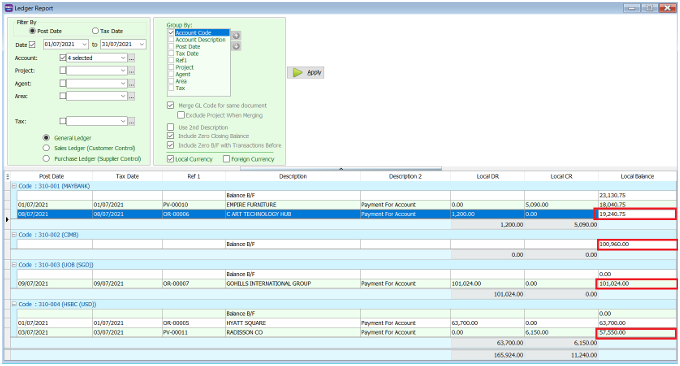
Maybank: RM 19,271.75 + CIMB: RM 100,960.00 + UOB(SGD$): RM 101,024 + HSBC (USD): RM57,550 = RM 278,805.75
-
Bank Balance
You can also see the current cash in bank balance for each bank account in your system.
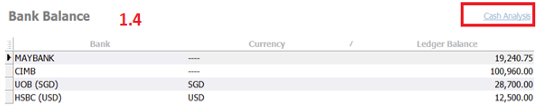
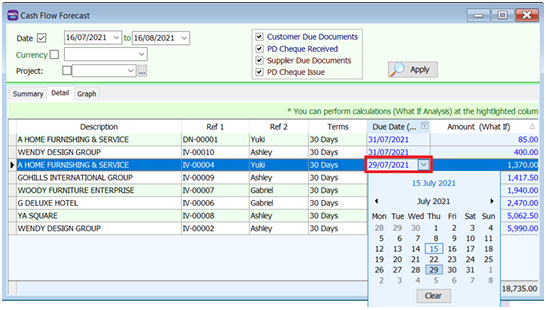
You can click on the word 'cash analysis' to see a cash flow forecast
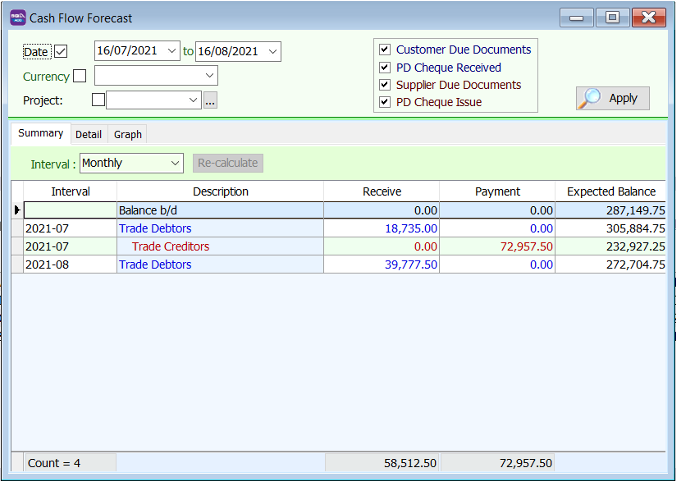
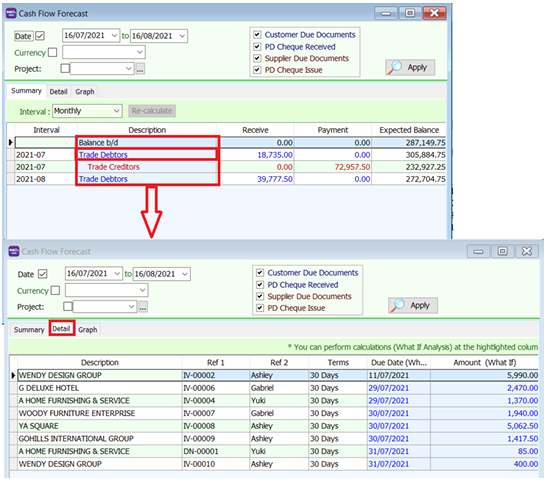
If you press on the words (eg. Trade Debtor) in the blue highlighted column, and then click the 'Detail' tab, you can perform an estimation calculation based on the Due Data and Amount collected.
-
Total Supplier Outstanding and Total Customer Outstanding
Total Supplier and Total Customer outstanding balance is summarised in this dashboard.
-
You can click on the “Total” or “Undue” words, and if will bring you to the supplier/customer due document listing.
-
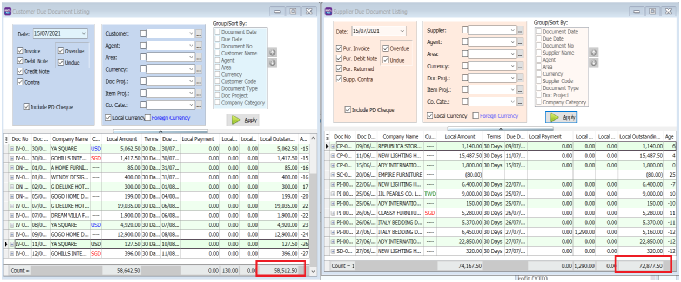
You will be able to generate a more detailed report from the Supplier/Customer Due Document Listing.
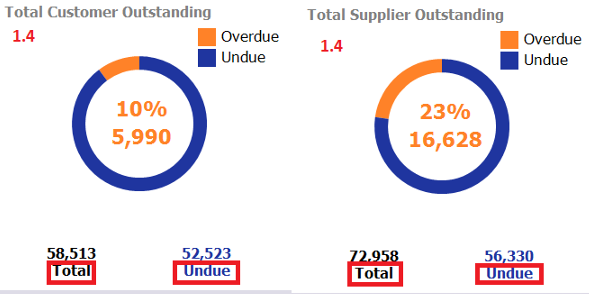
Total Customer Outstanding:
-
The amount undue is RM52,523.00. The current working date is 15/07/2021.
-
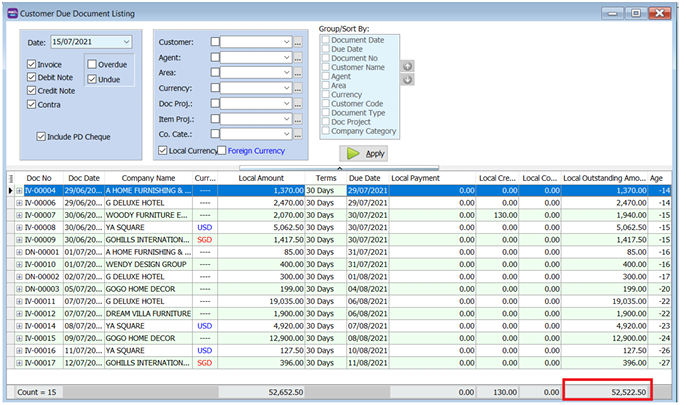
When refer back to the customer due document listing report. It is shown that the amount is RM52.522.50. the amount has been rounded up.
-
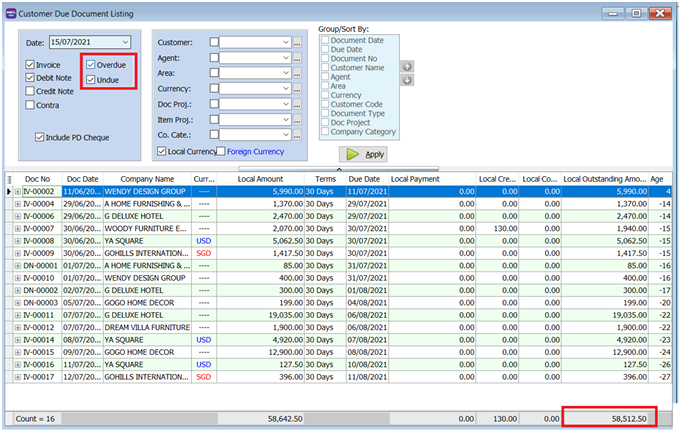
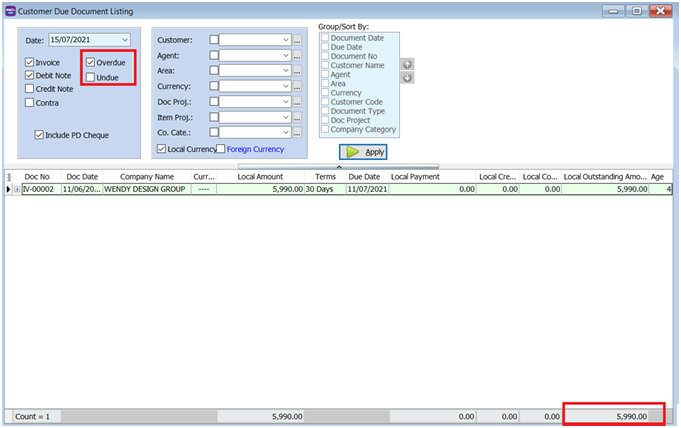
The total amount is RM58,513.00. Total amount is a combination of both overdue and under due amount. The amount in the Customer Due Document listing report is RM58,512.50. The amount is rounded up.
-
You can check the overdue amount by unticking the undue check box. It is the same amount in the dashboard and the Customer Due Document Listing Report. Both shows RM5,990.
Total Supplier Outstanding
-
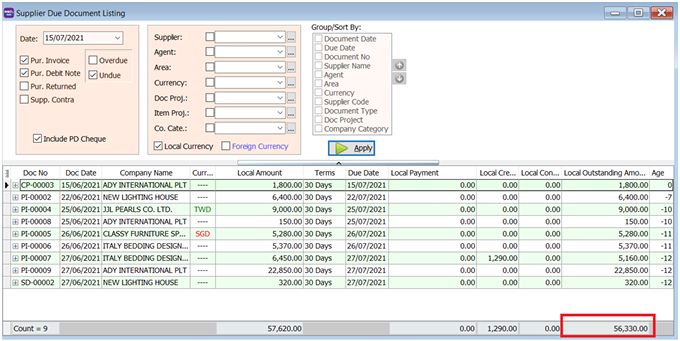
The amount undue is RM56,330.00. the current working date is 15/07/2021. When refer back to the customer due document listing report. It is shown that the amount is exactly the same.
-
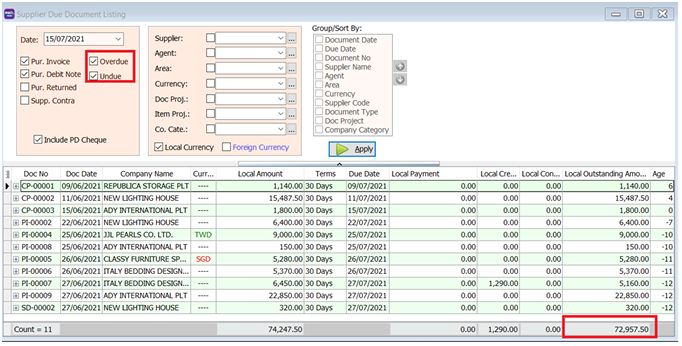
The total amount is RM72,958.00. Total amount is a combination of both overdue and under due amount. The amount in the Customer Due Document listing report is RM72,957.50. The amount is rounded up.
-
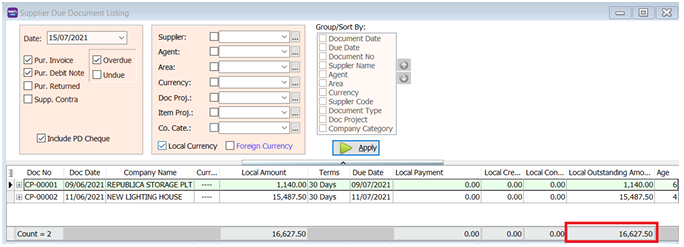
If you want to double check the amount overdue. You can untick the undue and press apply. It’ll be the saxme as in the dashboard or rounded up to the nearest ones.
-
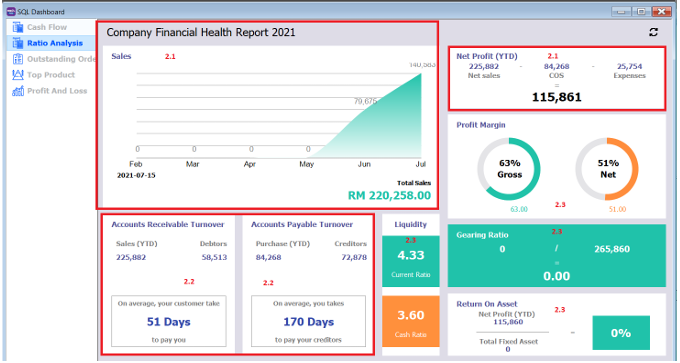
2. Ratio Analysis
-
You can see the company’s financial health report.
-
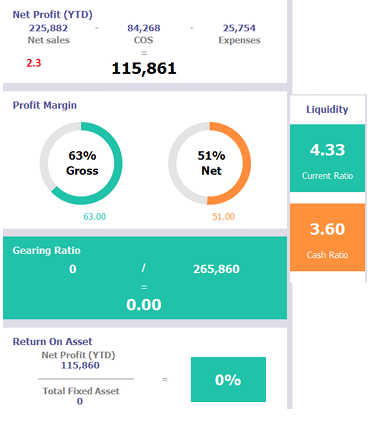
Sales , Net Profit (YTD)
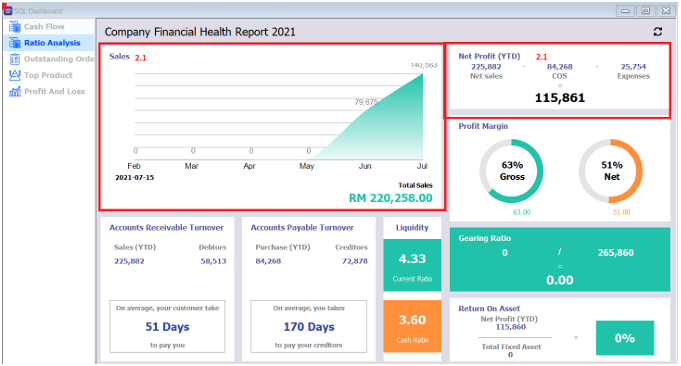
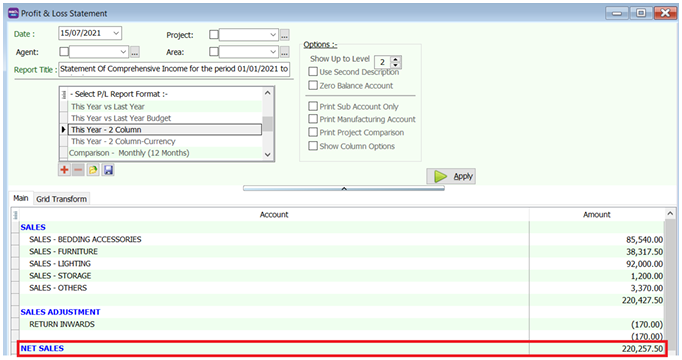
The Total sales is obtained from GL -> Profit & Loss Statement. Under “Net Sales” on the current working date.
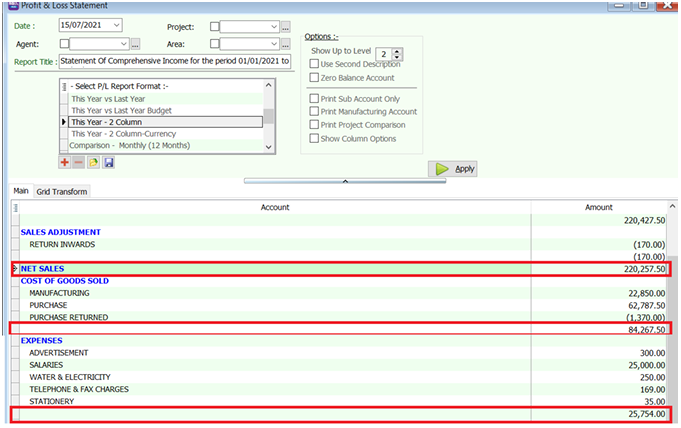
The Net Profit is gathered from the Net sales – Cost of Goods Sold – Expenses
-
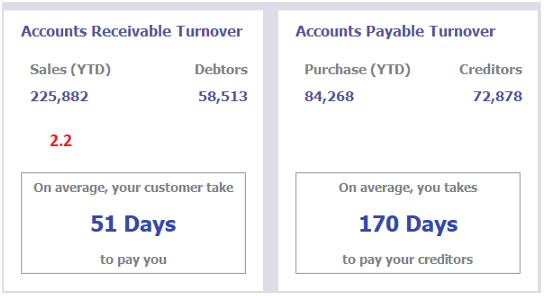
Accounts Receivable Turnover & Accounts Payable Turn Over
-
The Sales YTD and Purchase YTD is obtained fom the Profti and loss under “Net Sales” and “Cost of Goods Sold”.
-
The Debtor and Creditor amount can be found under the Customer Due Document Listing and Supplier Due Document Listing.
-
The average days to customer payback is calculated by Debtor Amount / Average Sales per Day. Same formula is used for creditors.
Debtor Amount = RM 58,513
Average Sales per Day = Sales YTD / Start of Year – Workig Date
Average Sales per Day = 225,882 / ( 01/01/2021 – 15/07/2021)
Average Sales per Day = 225,882 / 195
Average Sales per Day = 1158.37
Average Days for debtor’s payment = RM 58,513 / 1158.37 = 51 Days
-
-
Profit Margin, Gearing Ration, ROA, Liquidity
The dashboard also shows you the current Net Profit Margin , Gearing Ratio, Return On Assets as well as liquidity ratios. This information can be used for your performance analysis and management.
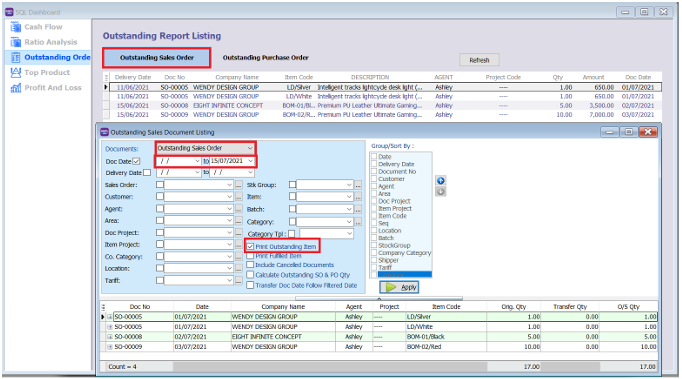
3. Outstanding Order
-
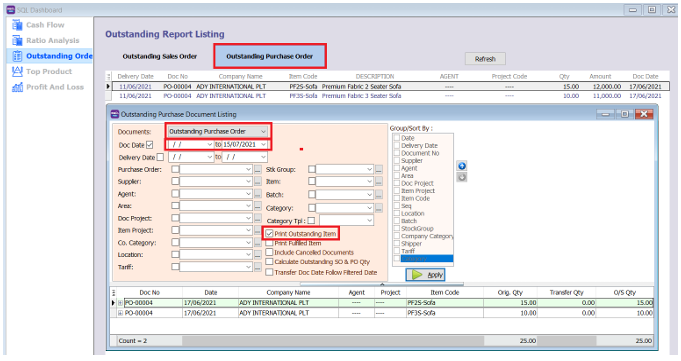
You can press on either ”Outstanding Sales Order” or “Outstanding Purchase Order” to see the sales order / purchase order documents that have not been transferred as of the current working date.
-
You can go to Sales -> Outstanding Sales Document Listing and compare the documents and see the outstanding Sales Order in detail.
You can go to Purchase -> Outstanding Purchase Document Listing and compare the documents and see the outstanding Purchase Order in detail.
4. Top Product
You can set the date period and see the top 10 stock items that your company sells. The top 10 can is rated based on quantity of the item and based on total sales
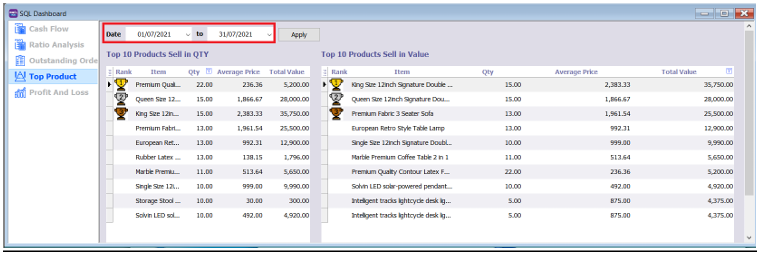
-
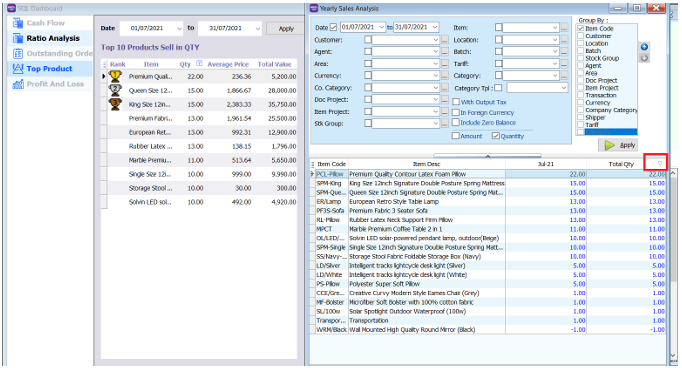
Top 10 product Sell in Qty is based on Sales ->Yearly Sales Analysis Report. Sort the quantity in descending order and you will get the top 10.
-
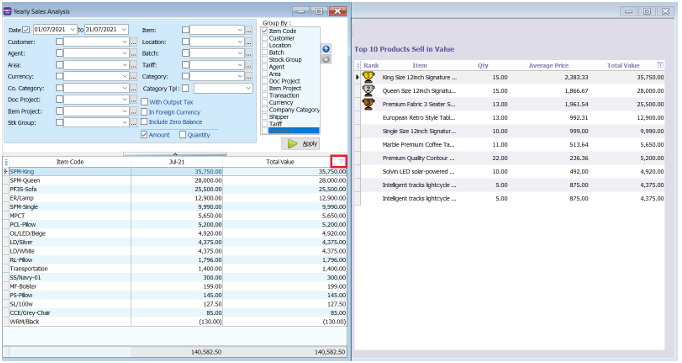
Top 10 product Sell in Value is based on Sales -> Yearly Sales Analysis Report. Sort the total value in descending order and you will get the top 10
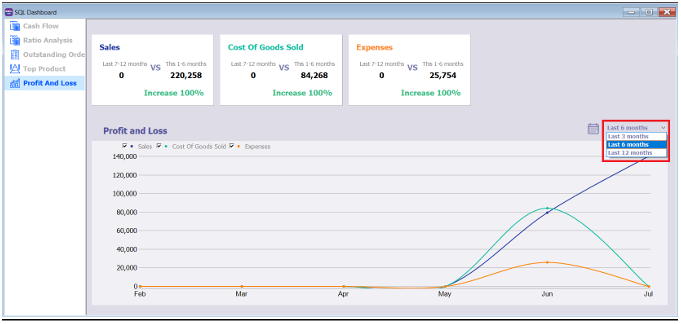
5. Profit and Loss
-
In this dashboard, you can see the comparison of Sales, Cost of Goods Sold (COGS), and expenses between the past 7-12 months and the current 1-6 months.
-
The information is based on the current working date.
-
The profit and loss information is show in a line graph. You can select the period of the information that you want to see. You can choose to see that P&L for the last 3 months, 6 months or 12 months.