Dashboard
Dashboard Overview
The Dashboard is the main page where you can see how your stores are doing. It shows you the latest information on sales, orders, stock, and whether your stores are connected properly.
Date Filter

Pick a time period to see its data. You can choose:
- Today
- Last 3 Days
- Last 7 Days
- Last 1 Month
- Last 2 Months
- Last 3 Months (Default view)
Chart Data

Choose what kind of numbers you want to see:
- Amount: Show the total money from sales for that time.
- Total: Show the total number of sales for that time.
Chart Types

Choose how you want the numbers to look:
- Table: Shows exact numbers in a list.
- Bar Chart: Shows numbers as vertical bars to compare different times.
- Line Chart: Shows a line to see if sales are going up or down.
- Pie Chart: Shows a circle divided into parts to see which time had more sales.
Payments Section
This part shows you the money side of your business.
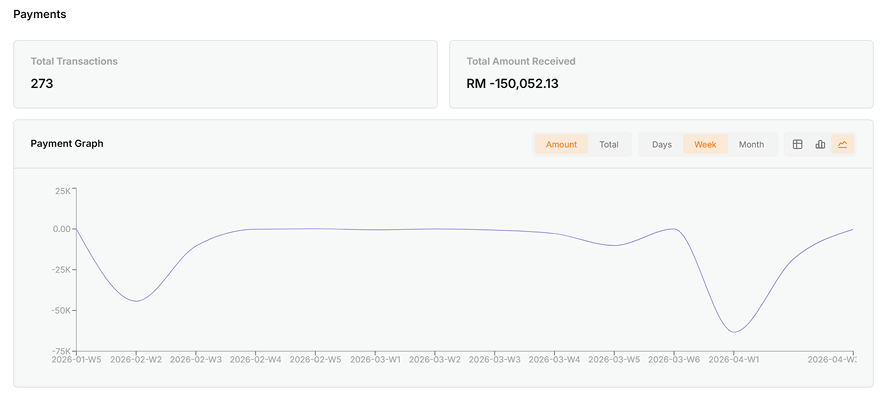
Main Numbers
- Total Transactions: Total number of payments received.
- Total Amount Received: Total amount of money from all payments.
Payment Chart
A picture showing your payment trends. You can change how it looks using the buttons on the top-right.
Group by Time

Choose how to bundle your payment data:
- Day: See total money for each day.
- Week: See total money for each week.
- Month: See total money for each month.
Orders Section
This part shows you how many orders you have and where they come from.
Order Numbers

- Total Orders: The total number of orders you have received.
- Orders Today: How many orders you got today.
- To Ship: How many orders are waiting for you to send out.
Order Details
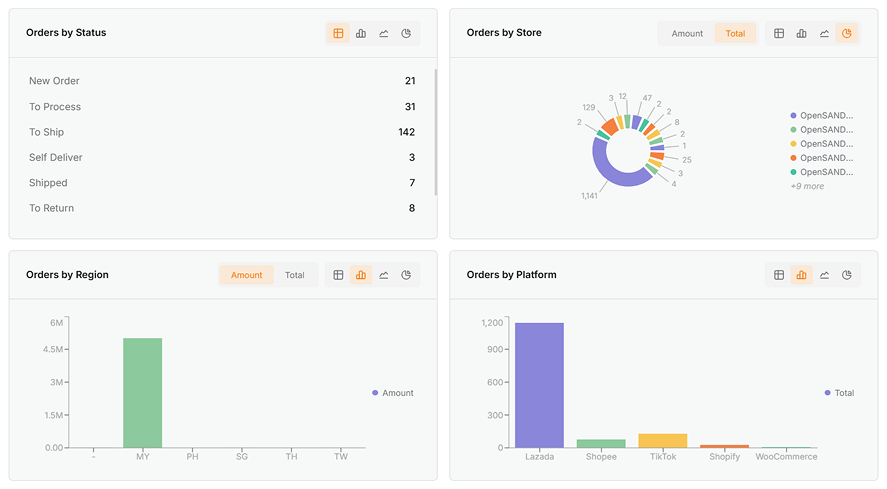
- Orders by Status: Shows all order statuses from all stores.
- Orders by Store: Shows which individual store (like a specific Lazada or Shopee store) is getting orders.
- Orders by Region: Shows which country or area the orders are coming from (like MY or SG).
- Orders by Platform: Compare how many orders come from Lazada vs Shopee vs other sites.
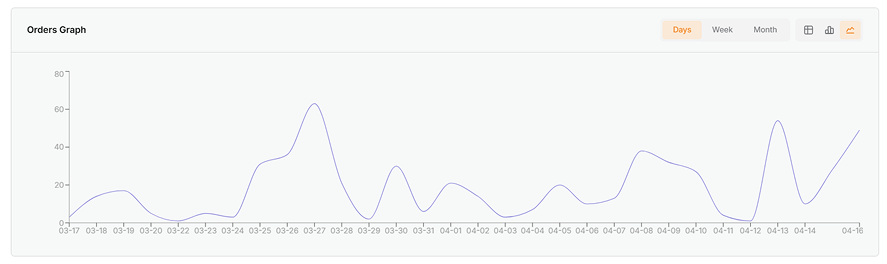
- Orders Chart: A line or bar showing if you are getting more or fewer orders over time.
Products Section
Check your stock and how well your items are selling.
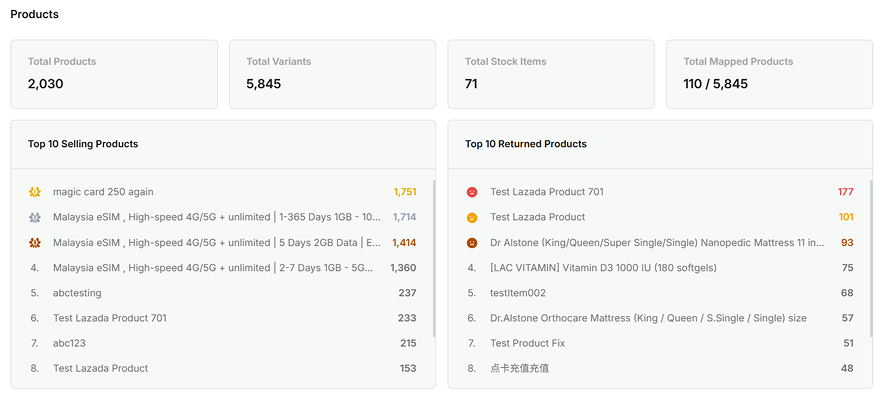
Stock Numbers
- Total Products: How many different types of items you sell.
- Total Variants: The count of different choices for items (like different sizes or colors).
- Total Stock Items: The total count of all items you have ready to sell.
- Total Mapped Products: How many items are correctly linked between your online store and SQL Account.
Product Info
- Top Selling Products: A list of your most popular items.
- Top Returned Products: Items that customers send back most often. This helps you find problems with certain products.
Stores Section
Manage your different selling channels.
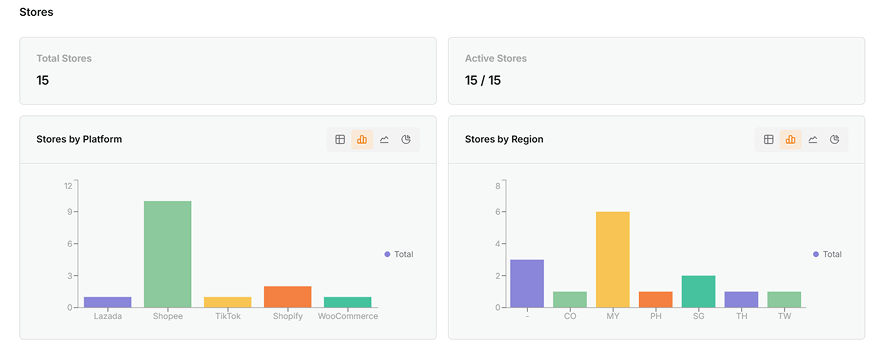
Store Numbers
- Total Stores: The total number of online stores you have connected.
- Active Stores: How many stores are currently working and sharing data.
Store Locations
- Stores by Platform: Shows how many stores you have for Lazada, Shopee, or TikTok and more.
- Stores by Region: Shows where your stores are located (like MY, SG, and more).